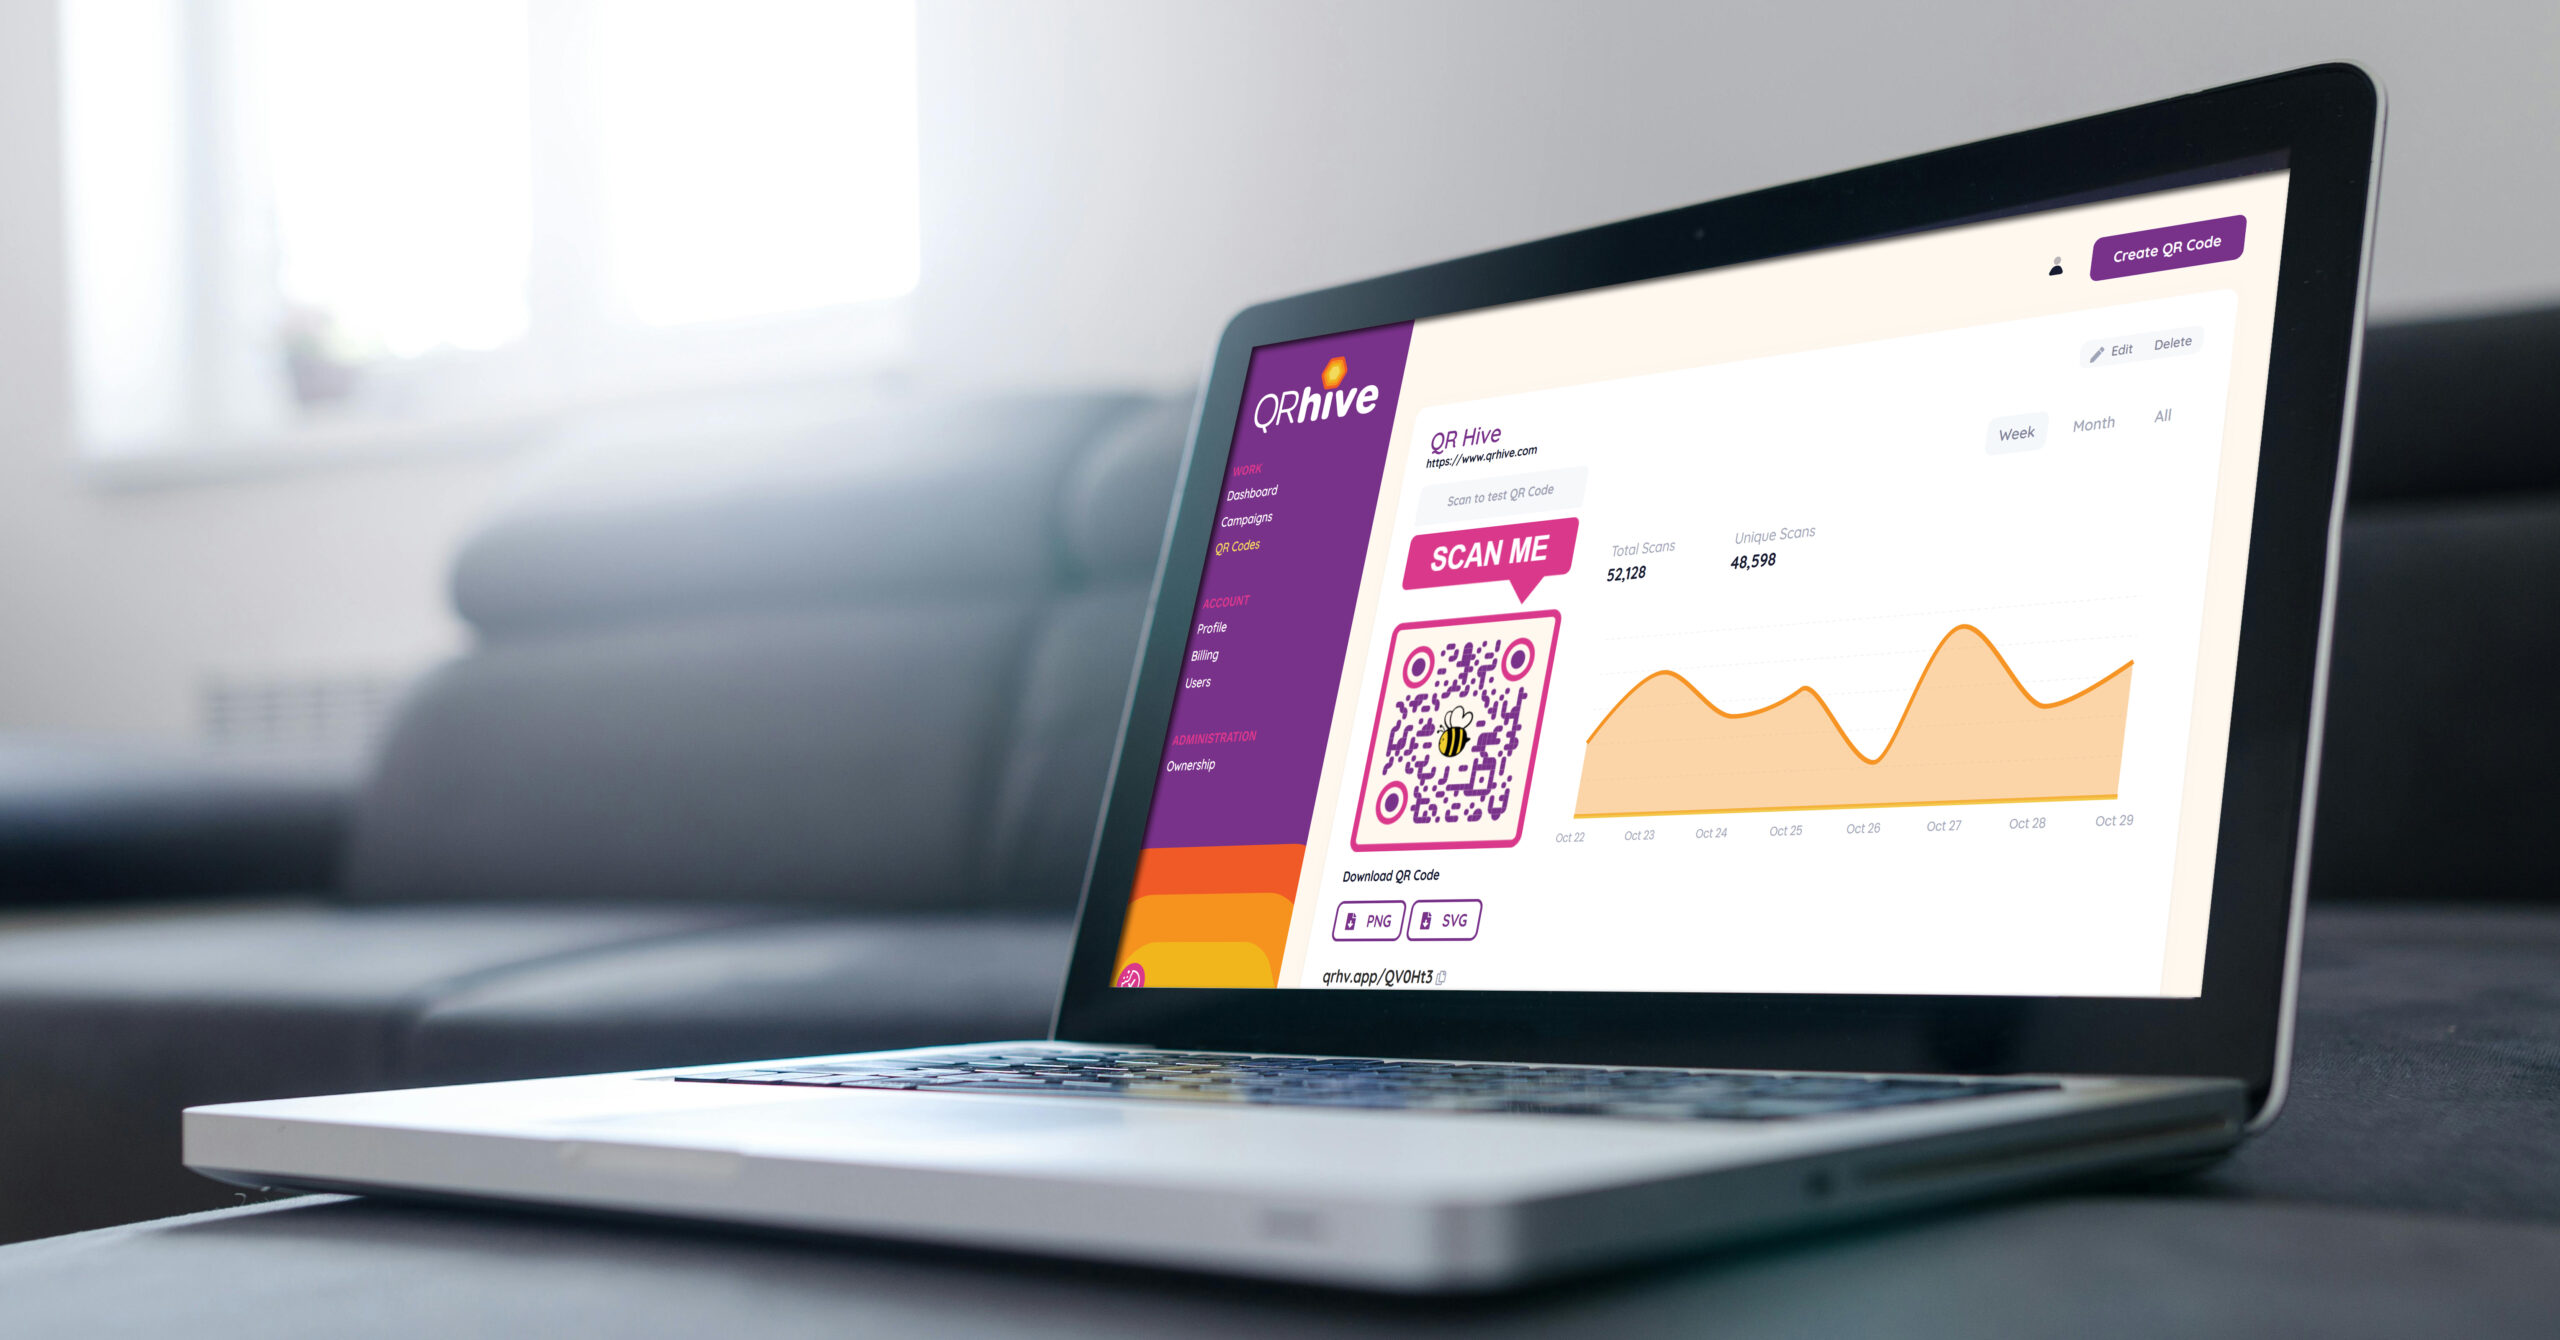
It’s one thing to use QR Codes to make sure that users get to your site – it’s another to measure their performance. As marketing professionals, we’re always looking for ways to measure the effectiveness of advertising campaigns. QR Codes can give you another way to track ROI on advertising media that is traditionally hard to measure.
QR Code Tracking by Campaign
One of the unique features behind of QR Hive comes from the understanding that marketers need to not only measure by individual codes, but they want to see the overall effectiveness of their campaign, which may mean multiple QR Codes.
Case study:
A Cookware company has multiple active campaigns that covers direct mailers, OOH / billboard, local public transport and streaming TV. Each of these media types have been given their own unique QR Code so that the marketing insights can be individually measured. They also grouped these codes within QR Hive campaigns so that they could quickly check QR Code engagement by Campaign performance and the singular Codes.
The QR Hive campaign overview page shows you the list of all the campaigns along with the unique and total code scans. This allows you to quickly identify the campaign that has had the most engagement through QR Codes.

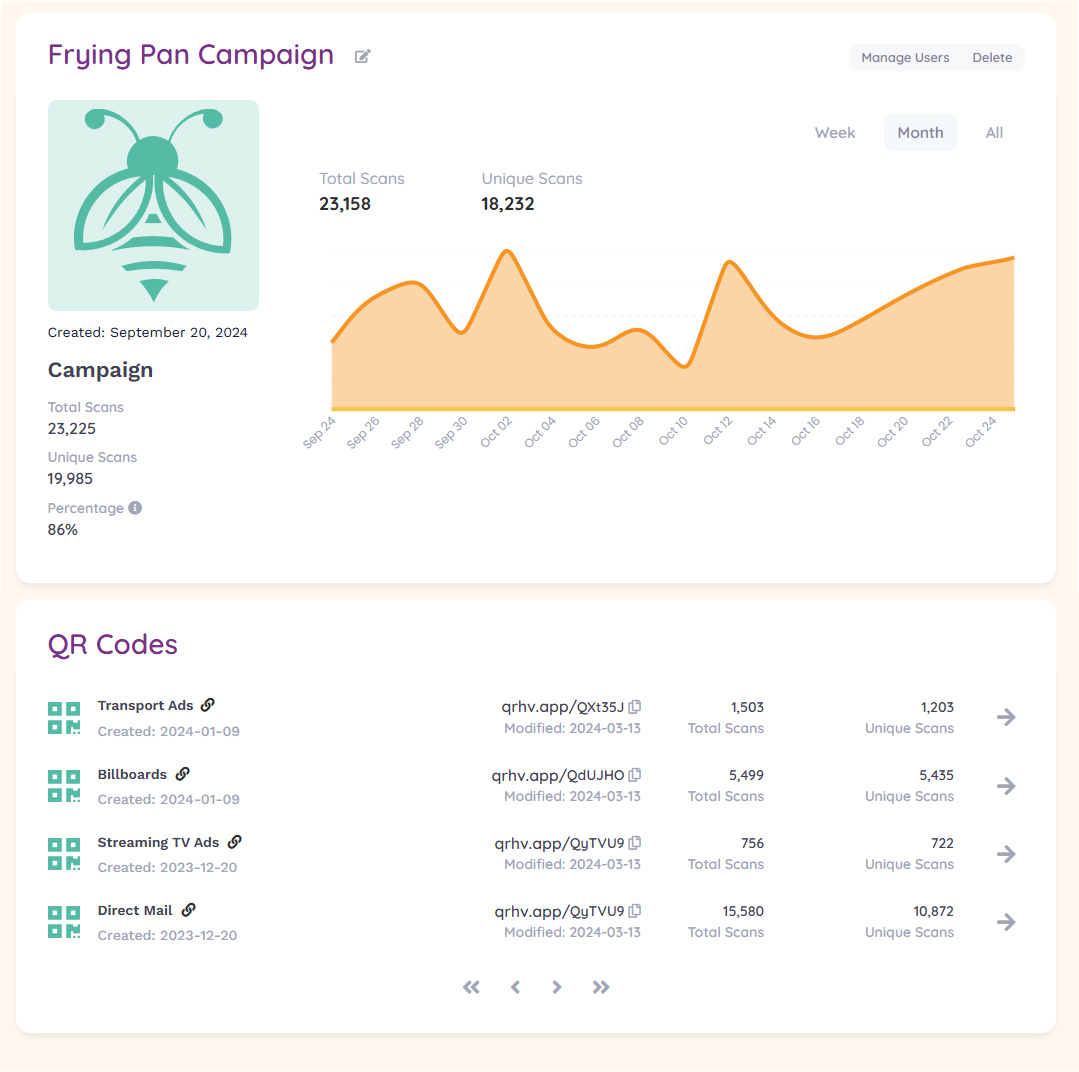
With a quick glance, the client can see that their Frying Pan QR Code Campaign performance was the best of all of their QR Code campaign engagement. When the client wants to dig deeper and see more campaign insights, they’re available by clicking on the Campaign.
On the campaign detail page, the client will see their daily campaign traffic by week, month or from the campaign start. They can also see the breakdown of each QR Code within the campaign. In this case, their direct mail QR Code really drove the most traffic in the campaign!
Now that the client has a good idea of the overall campaign traffic, they want to analyze the traffic from one specific QR Code. They can either click the QR Code found in the campaign details page, or they can go to the QR Code overview page.
QR Code Analytics:
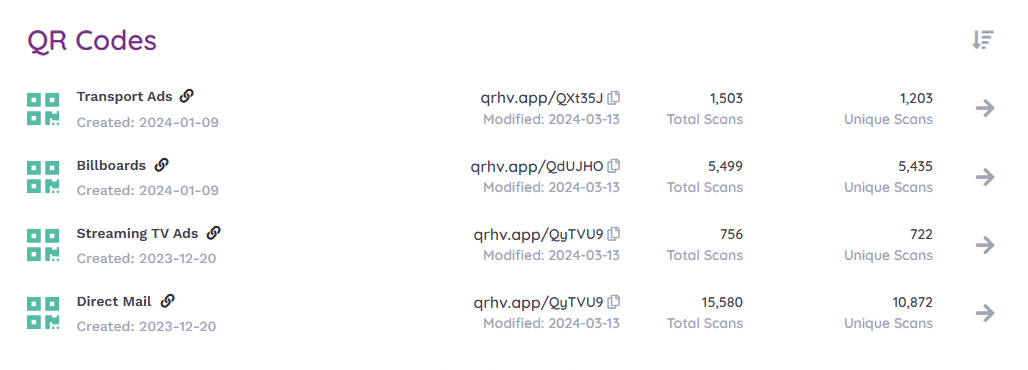
The QR Code overview page shows you a list of all your QR Codes regardless of what campaign they might be within. The sorting icon on the top right corner has multiple options to change how this list is sorted. To See the full QR Code analytics, just click on the QR Code name or arrow on the far right of the row.
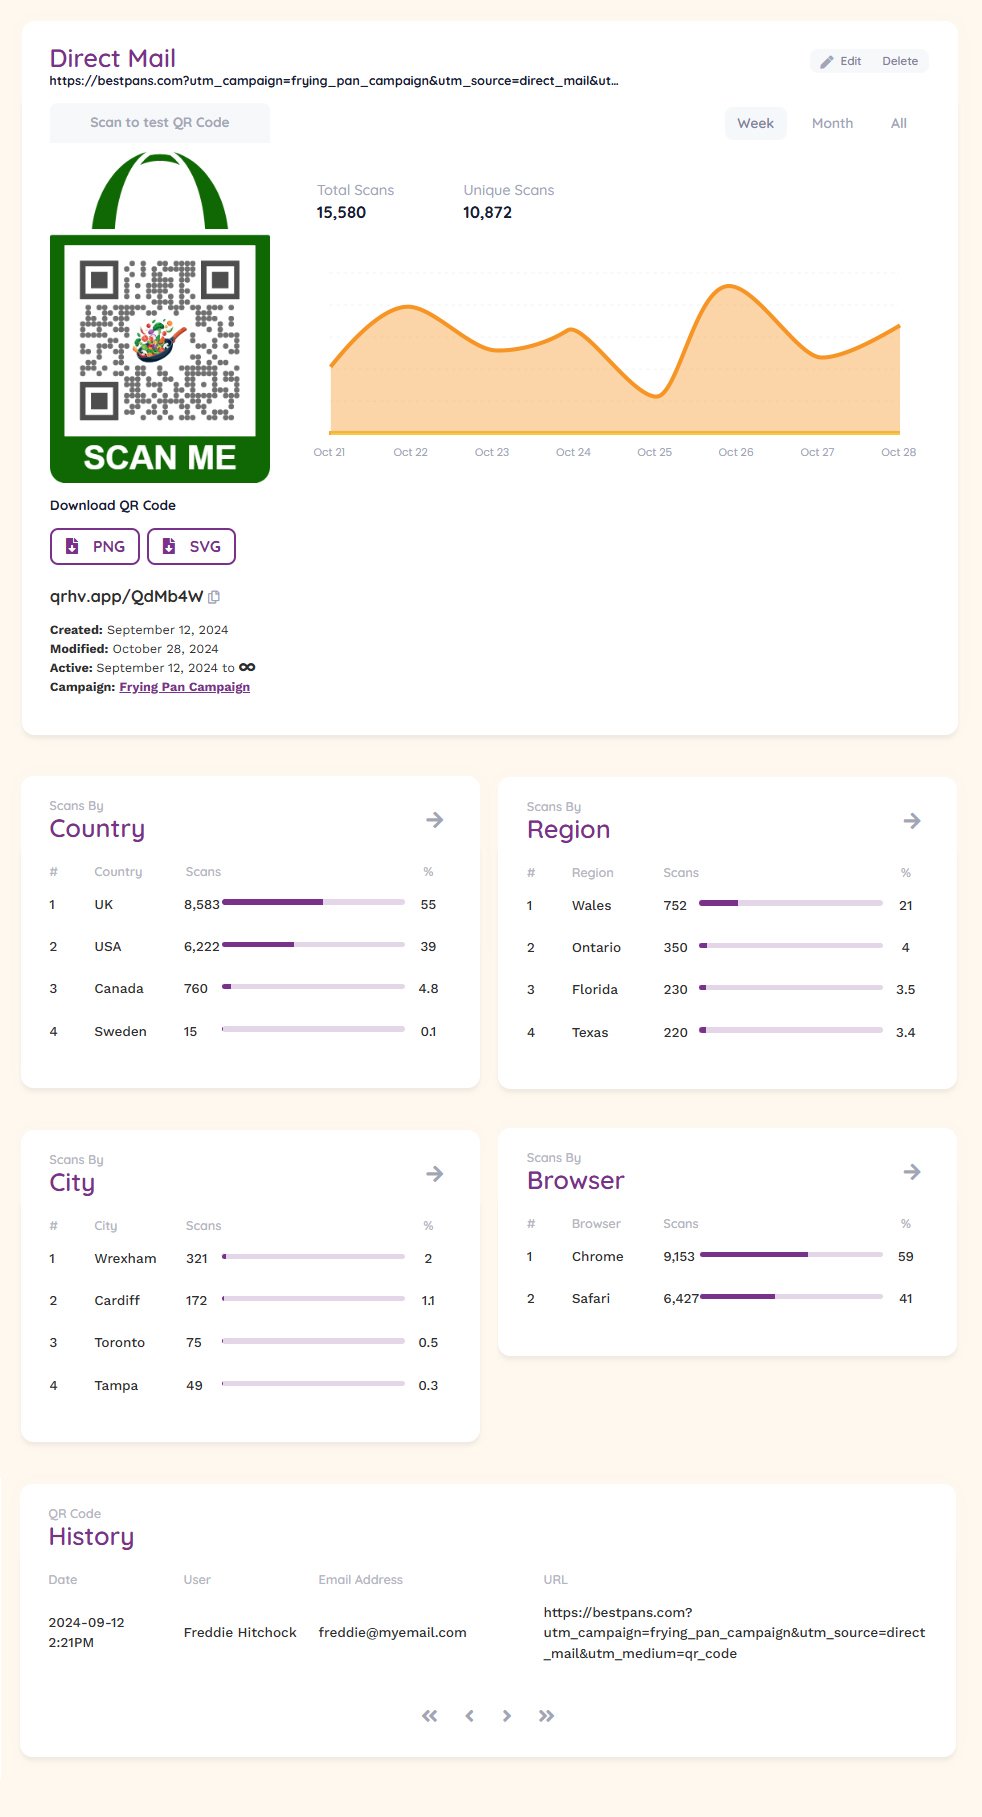
Once you enter the QR Code detail page you’ll be able to gather a wealth of information about how your QR Code performed! View your traffic by daily, monthly or all, check out your QR Code Scans by country, region, city and browser. Each of these sections open to show you the full results of each area.
If you need to download another file of your QR Code, you can download a PNG or SVG file here.
If you need to change the URL (landing page) of your QR Code, just click the edit button to take you into the QR Code editor.
If you’re using an account where team members can contribute and make changes to your QR Codes, everyone can see when and who made changes to the QR Code in the History Section at the bottom of the page.
Tracking within Google Analytics
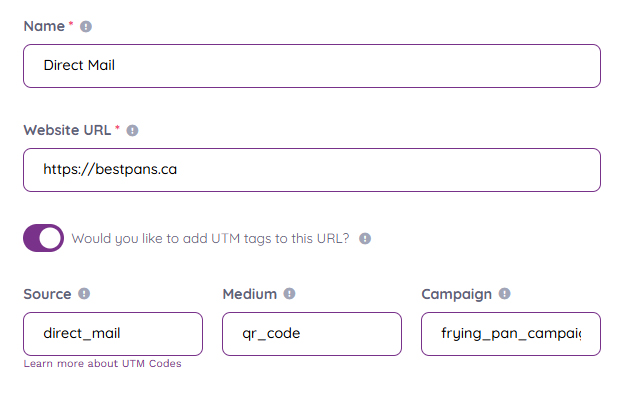
To ensure that QR Code traffic shows in Google Analytics, you should ensure that you use the UTM area in the QR Code generator. The terms you use in “Source”, “Medium” and “Campaign” will automatically appear in Google Analytics Traffic.
Ready to get started?
For one low monthly cost you can create unlimited dynamic QR Codes and unlimited Campaigns!
Simplifying Weddings with QR Codes
Are you worried about how much time you have to plan your perfect wedding? Are you looking for some
How QR Codes Can Help Small Businesses Grow Their Customer Base
We know that as a small business your time is fragmented and limited. QR Codes can help take some

